


Facility management dataWe are not the FM system. We are the data underneath it.
A facility management platform is only as good as the building data in it. Most implementations stall in the same place: nobody has an accurate, current record of the spaces and assets the system is supposed to manage. That record is what an existing conditions survey produces.

What we hand over
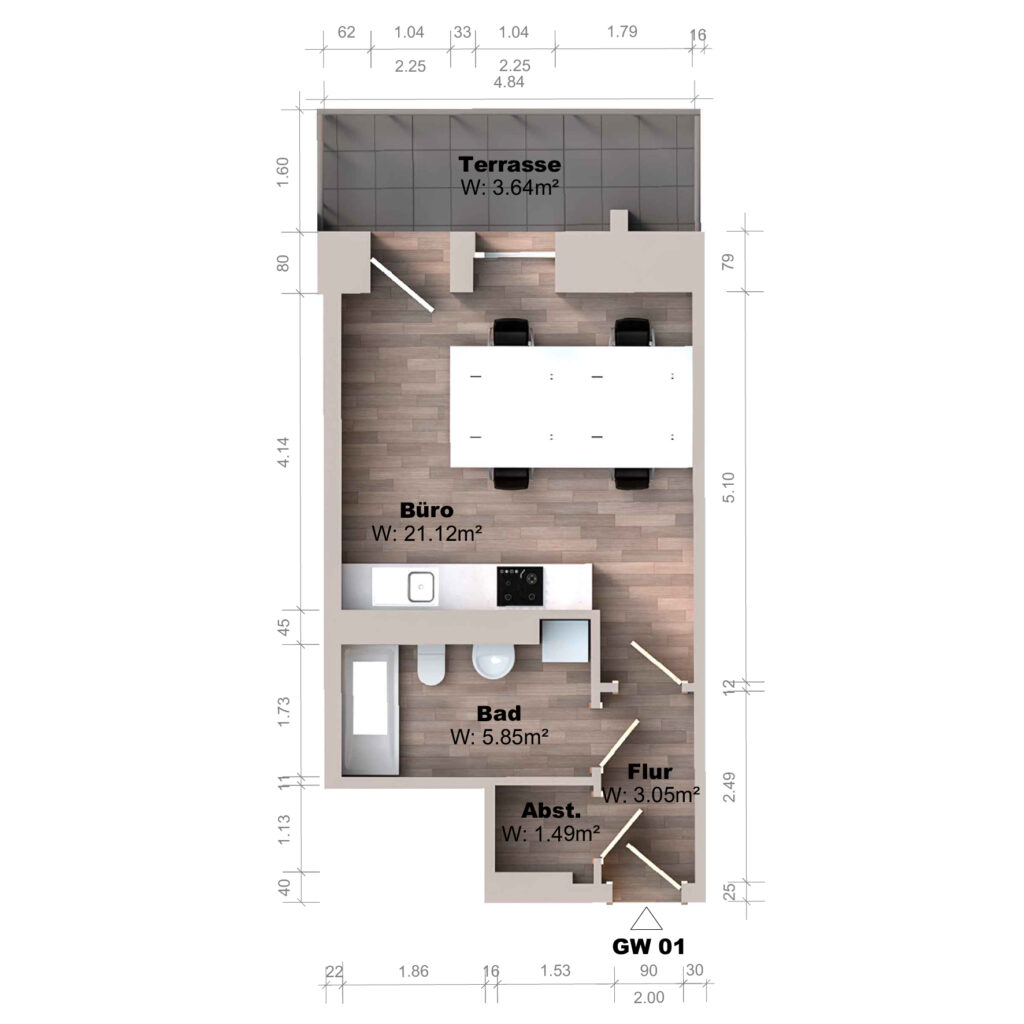
- Room schedule — every space with number, name, use, and measured area.
- Floor plans in DWG, structured so an FM system can import them rather than just display them.
- Area calculations to the standard your organization reports against.
- Asset records for the equipment in scope, captured in place during the survey.
- Registered point cloud, so a question in two years does not require a new survey.
Vendor-neutral by default: DWG, IFC out of the Revit model, and tabular formats any platform can take. We have no stake in which system you run, which is exactly why the data works in all of them.
Why it usually goes wrong
Building data is typically assembled from whatever exists — old CAD files, a lease plan, a spreadsheet somebody maintained until they left. Each source uses different room numbering and a different idea of what counts as area.
Capturing it once, from measurement, removes the reconciliation problem instead of moving it somewhere else. It is also the only version that stays defensible when a tenant disputes a chargeback.
Captured on site, not typed up later
Room attributes and asset data are recorded during the survey on a browser-based tool, not transcribed from photographs afterwards. Fewer hands, fewer transcription errors, and the data arrives with the drawings rather than weeks behind them. Where the team also needs to see the space, a virtual tour comes out of the same capture.
What the room schedule contains
One row per space, tied to the drawing by room number, and structured so a platform can import it rather than a person retype it.
| Field | Example | Why it is in there |
|---|---|---|
| Room number | 04-118 | The key everything else joins on. Agreed with you before capture, because renumbering afterwards breaks every link. |
| Room name and use | Server room, technical | Drives maintenance regime, access rules and reporting categories. |
| Measured area | 412 sq ft | From the survey, not from the lease plan. This is the number tenants argue about. |
| Clear height | 8 ft 11 in | Decides racking, equipment and whether a route through the ceiling exists. |
| Floor finish | Raised access floor | Cleaning contracts and replacement cycles are costed per finish. |
| Assets in place | 2 AHUs, 1 panel | Captured during the survey with location, not transcribed from photographs later. |
Delivered as CSV or XLSX alongside DWG and IFC. No proprietary container, because the platform you run today is not necessarily the one you run in five years.
Area is not one number
Four departments can each report a different size for the same floor and all four can be right, because they are counting different things. The definition has to be agreed before capture rather than reconciled afterwards.
- Gross area to the outside face of the envelope. Used for construction cost, insurance and portfolio comparison.
- Rentable area including a share of common space. This is the lease number, and it follows whichever standard the lease cites, commonly a BOMA or ANSI definition.
- Usable area inside the demised space. What a fit-out designer works to.
- Program area by function: clinical, teaching, storage. What operations and space planning report against.
We produce whichever set you report against and state the definition on the deliverable. A number without its definition is where chargeback disputes start.

What this looks like by portfolio
Healthcare
Room use changes faster than the drawings, and clinical space carries compliance obligations that depend on knowing exactly what is where. Capture runs around clinical schedules, often at night, and the deliverable usually pairs the room schedule with a services record for the plant that supports each department.
Education
Large estates, thin records, and reporting that turns on program area rather than lease area. Teaching space is measured to the function it is used for, not to the label on the door, because utilization reporting is the reason the data is being collected in the first place.
Corporate office
Occupancy and desk ratios sit on top of usable area, so the definition matters more than the precision. Portfolios are captured to one structure across every building, which is what makes floor-by-floor comparison possible at all.
Logistics and industrial
Clear heights, dock counts and column grids carry more weight than room names. Mobile capture covers the volume quickly, and the asset record concentrates on plant, dock equipment and fire systems rather than on every space.
Why building data goes stale, and what helps
- Renumbering. A floor renumbered after capture invalidates every join. We agree the numbering scheme first and hand back the mapping table if an old scheme has to survive alongside the new one.
- Mezzanines and voids. Counted twice, or not at all. Both happen, and both show up as a portfolio that does not add up. These get an explicit rule in the deliverable.
- Shared and service areas. The share allocated to a tenant is a contractual decision, not a survey decision. We measure it and let the lease decide how it is apportioned.
- Four sources, four answers. Old CAD, a lease plan, a spreadsheet and a platform export rarely agree. Capturing once from measurement removes the reconciliation rather than moving it.
- Data with no cloud behind it. Keep the registered point cloud and a question in two years is a desk exercise instead of a new survey.
When you need something else
- Design work against the building: as-built drawings or scan to BIM, from the same capture.
- A visual record for teams inheriting a building: a virtual tour alongside the data.
- Whether a structure is moving: deformation monitoring, which is a different measurement discipline.
- A platform to run it in: not us. We produce the data your system runs on and have no software to sell you.
Frequently asked questions
What is the difference between this and an as-built survey?
Same capture, different output. An as-built survey produces drawings for design. This produces structured space and asset data for operation. Most clients who need one eventually need the other.
Do you handle asset tagging?
We record assets in place during the survey and deliver them against the room schedule. Physical tagging is usually done by the FM provider, and our data tells them what to tag and where it is.
Which FM systems can use this?
Any that import DWG, IFC or tabular data — which is effectively all of them. We deliver in neutral formats rather than one vendor’s proprietary structure, so a platform change later does not invalidate the survey.
How are areas calculated?
To the standard you report against. We agree it before capture, because retrofitting a different area definition afterwards means redoing the work rather than adjusting a number.
Can you cover a whole portfolio?
Yes, and that is where the approach pays off most: one method and one data structure across every building instead of a different record format per site. Multi-site programs are priced 10–20% below single-building rates, against the bands on the pricing page.
Do you replace our existing system?
No. We produce the building data your system runs on. We have no software to sell you, and that independence is the point rather than a disclaimer.

Implementing or migrating an FM system?
The data is usually the bottleneck. Tell us the portfolio and we will scope it.